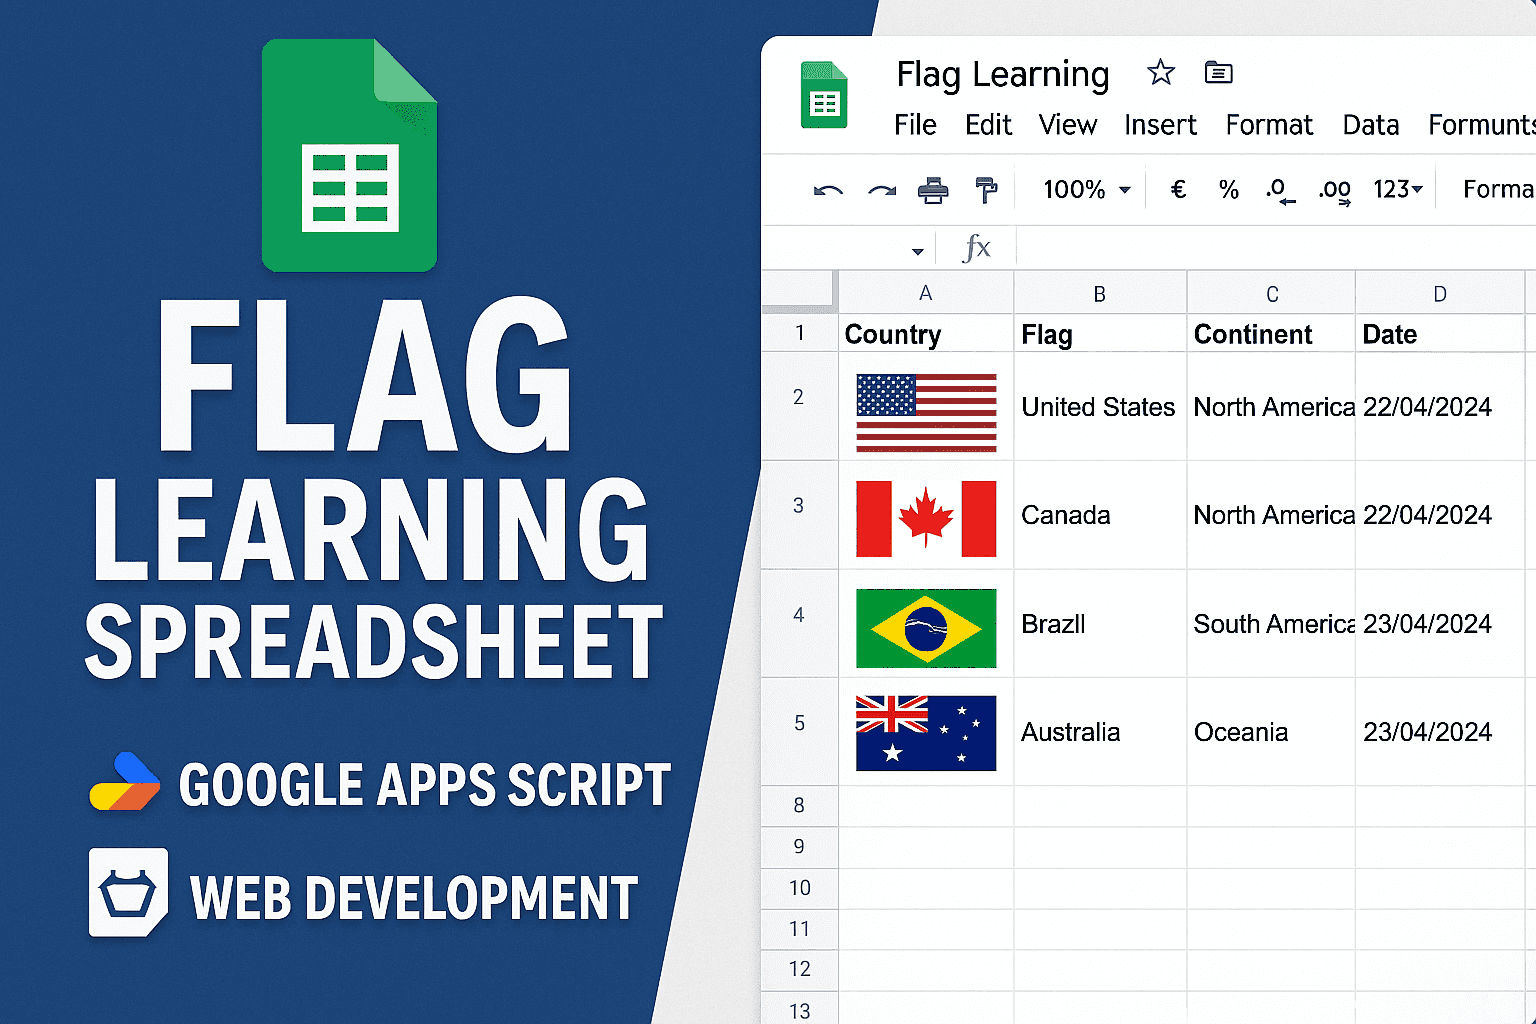
🏴 Vexillology Quiz Results
This repository contains data extracted from a Google Sheet tracking performance on world flags and U.S. state flags quizzes.
The dataset provides raw scores, aggregated country statistics, and U.S. state breakdowns — perfect for analytics, visualization, or improving your flag knowledge.
📁 File Overview
| File | Description |
|---|---|
Vexillology |
Source spreadsheet containing all quiz data, structured across three sheets: Scores, Countries, and States |
🧾 Sheet Descriptions
1. 📊 Scores
Detailed results per country code, including correct and incorrect answers.
- Rows: 306
- Columns: 6
| Column | Description |
|---|---|
Code |
ISO-style country code (e.g. ad for Andorra) |
Country |
Full country name |
Correct |
Number of correct identifications |
Incorrect |
Number of incorrect guesses |
Total |
Total attempts (Correct + Incorrect) |
Percent |
Percentage of correct answers |
Sample:
| Code | Country | Correct | Incorrect | Total | Percent |
|---|---|---|---|---|---|
| ad | Andorra | 0 | 1 | 1 | 0 |
| ae | United Arab Emirates | 0 | 0 | 0 | 0 |
| af | Afghanistan | 0 | 0 | 0 | 0 |
| ag | Antigua and Barbuda | 0 | 0 | 0 | 0 |
| ai | Anguilla | 0 | 1 | 1 | 0 |
2. 🌍 Countries
Aggregated stats by country. Useful for leaderboards, accuracy rankings, and identifying knowledge gaps.
- Rows: 119
- Columns: 3
| Column | Description |
|---|---|
Country |
Full country name |
Total |
Total number of attempts |
Percent |
Overall accuracy percentage |
Sample:
| Country | Total | Percent |
|---|---|---|
| Andorra | 1 | 0 |
| Anguilla | 1 | 0 |
| Albania | 1 | 100 |
| Angola | 2 | 100 |
| Bosnia and Herzegovina | 1 | 0 |
3. 🇺🇸 States
Breakdown of quiz performance for U.S. state flags, ranked by total attempts and accuracy.
- Rows: 50
- Columns: 3
| Column | Description |
|---|---|
Country |
U.S. state name |
Total |
Number of attempts |
Percent |
Accuracy rate |
Sample:
| Country | Total | Percent |
|---|---|---|
| Alaska | 8 | 87.5 |
| Alabama | 10 | 90 |
| Arkansas | 8 | 100 |
| Arizona | 4 | 75 |
| California | 13 | 100 |
📈 Potential Uses
- Data Visualization: Import into Tableau, Google Data Studio, or custom dashboards to visualize flag recognition trends.
- Learning Analytics: Identify which flags are most commonly missed and tailor study sessions accordingly.
- Leaderboard Generation: Use the
CountriesandStatessheets to rank performance by accuracy or attempt count. - Educational Insights: Track improvement over time by periodically updating the Scores sheet.
🛠 Suggested Next Steps
- Convert to CSV for easier programmatic access.
- Add timestamp data for time-based analysis.
- Build a small React or Svelte dashboard to explore trends interactively.
- Integrate with a quiz app to automate data updates.
👤 Author
Jordan Rhea
EdTech Consultant • Data Nerd • Flag Enthusiast

